Problems accessing GHG source data (e.g., utility or vehicle miles traveled (VMT) data) cause long delays in preparing and updating GHG inventories.
How this barrier is experienced across the state
Developing greenhouse gas (GHG) inventories present significant administrative, financial, and technical burdens for many jurisdictions. There are typically roughly 23 data sources that go into a greenhouse gas inventory. The number crunching required is extremely time consuming, especially on a one-off basis. Any GHG emissions inventory developed for CEQA purposes needs to be legally-defensible.
Participants note burdensome procedures for accessing the data as a major issue, as well as data cleaning. Of the needed data sources (see Figure 1), participants indicate that the most challenging data sets are utility data and VMT data.
According to the ICLEI US Community Protocol & the Global Protocol for Community-Scale Greenhouse Gas Emission Inventories, GHG sources and methods should be: 1) relevant, 2) accurate, 3) complete, 4) transparent, 5) consistent (over time), and also 6) accessible (this has implications for cost and availability). However, participants relayed that the sources and methodologies change all the time and are difficult to reconcile and keep up to date with; also, the wide range of methods in use means one cannot compare across neighboring regional jurisdictions
Local governments have called for transparent, consistent, and affordable data. Various tools exist but there are challenges. None share a consistent methodology that ensures inventories are comparable across jurisdictions and across communities. Some of the tools are not freely accessible. Some rely on data sets that are not relevant to local jurisdictions and are thus not useful in the CAP development process. Private tool providers may want to keep some data private and proprietary, which limits transparency and utility. Attendees suggest preferred tool providers should offer up-to-date and regular maintenance; follow accepted protocols; no black-box calculations; use local datasets and emission factors; demonstrate subject matter expertise, and be consistent across methodologies and jurisdictional boundaries.
View the details on what communities have shared with SLECC from across the state.
Key challenge discussed in - San Francisco Bay Area, Statewide
Utilities, state agencies, and regional entities hold the energy-use data needed for GHG inventories, but CPUC privacy rules, inconsistent release practices, lack of standardization, and poor interagency coordination make it extremely difficult for cities to obtain complete datasets. As a result, each local government must navigate a lengthy, months-long utility data request process and often pay consultants to recreate data that already exists, all without a centralized portal or clear access point.
Key challenge discussed in - Statewide
Frequent Methodological Changes Trigger Repeated Inventory Revisions. Changes in emissions factors, electricity supply assumptions, or transportation accounting methods require jurisdictions to repeatedly redo GHG inventories, even when underlying local activity has not changed.
Key challenge discussed in - Statewide
Misalignment Between Data Delivery Timelines and Inventory Cycles. Utility and transportation data frequently arrive too late to align with CAP update schedules, grant deadlines, or reporting cycles, forcing jurisdictions to revise inventories multiple times or rely on outdated inputs.
Key challenge discussed in - Statewide
Raw State GHG Data Requires Specialized Processing. When CARB or other state entities provide emissions-related datasets, the data is often delivered in raw or technical formats that require advanced expertise to convert into usable GHG inventories. This creates a bottleneck for jurisdictions without in-house data analysts.
Key challenge discussed in - Statewide
Inconsistent and Outdated VMT Data for Emissions Accounting. Jurisdictions rely on VMT estimates that are often outdated, regionally inconsistent, or based on unclear methodologies, making them unreliable for transportation emissions inventories. Many local governments lack the technical capacity or funding to independently generate inventory-grade transportation data.
Local Solution Opportunities
SLECC stakeholders have brainstormed the following solution opportunities that can be taken by local leaders. Existing examples of progress or pathways to make further progress are highlighted if known.
Local Solution
CAPs as Flexible, Living Frameworks. Jurisdictions can treat CAPs as adaptable frameworks, using iterative updates or living appendices to incorporate new data and science between major revisions, enabling policy adoption and implementation to proceed without waiting for perfect or complete inventories.
Existing Examples of Progress:
Further Progress Pathways
Region(s): Inland Deserts, Statewide
Local Solution
Regional Collaboration on Inventory-Grade Data. Local governments can work through counties, COGs, MPOs, regional climate authorities, and university partners to jointly generate or validate GHG and transportation emissions data. These partnerships reduce duplication, shorten timelines, and help translate complex datasets so smaller jurisdictions can apply inventory-grade data in practice.
Existing Examples of Progress:
Further Progress Pathways
Region(s): Inland Deserts, Statewide
Local Solution
A shared, centralized approach to GHG inventory production and data access should be established so that cities no longer need to recreate their own inventories. Inventory datasets should be compiled and transparently shared—whether by the state, counties, regional agencies, academic institutions, nonprofits, or consultants—using standardized methods and timelines to ensure consistency and reduce duplication.
Existing Examples of Progress:
1. A partnership between UC Berkeley (led by Chris Jones) and StopWaste is developing a simplified tool to prepare inventories to local jurisdictions at little to no cost. It includes equity indicators and will soon feature policy recommendation tools. Beta testing begins in February 2025, with walkthroughs and focus groups in March. 2. County-produced inventories are happening informally in some places, demonstrating a model to scale statewide. 3. UC Irvine is funded to inventory climate action plans and GHG inventories.
Further Progress Pathways
Region(s): San Francisco Bay Area, Statewide
State Solution Opportunities
SLECC stakeholders have brainstormed the following solution opportunities that can be taken by state leaders. Existing examples of progress or pathways to make further progress are highlighted if known.
State Solution
The state should build a unified, easy-to-navigate system for producing, standardizing, and sharing local GHG and energy data. This would include: A centralized statewide energy and GHG data portal—potentially by expanding existing platforms like the UCLA Energy Atlas to serve all regions and remain up to date, and by restoring free access to key tools such as ICLEI ClearPath for local jurisdictions. Standardized GHG inventory methods, timelines, and indicators statewide, ensuring that all jurisdictions work from consistent, comparable (“apples-to-apples”) data. Regularly produced and published local GHG inventories for every city and county, updated on a predictable statewide cycle to reduce duplication, support regional planning, and inform state policy.
Existing Examples of Progress:
1. Given the very high interest in a state-led process to conduct local GHG inventories , an effort was made in 2023 to propose State legislation that would allocate budget to CARB to produce local GHG inventories for local governments (SB-511), which was suspended after receiving an estimated total cost of $18 million from the Department of Finance. 2. Local government participants expressed that they are aware of many other data portals led by the State designed to provide data to local governments
Further Progress Pathways
Region(s): San Francisco Bay Area, Statewide
State Solution
Enhance public access and coordination of climate data resources. Integrate and streamline climate data tools across universities and agencies, ensuring key datasets are updated frequently and made easily accessible to support local planning and decision-making.
Existing Examples of Progress:
Cal-Adapt follows the global climate data cycle—updated roughly every 5–6 years—and that the state is developing evolving tools like the Vulnerable Communities Platform to “add new information as it’s available” and help planners align to the latest assessment data
Further Progress Pathways
Region(s): Inland Deserts, Statewide
State Solution
Targeted technical assistance and training on GHG data and inventories. State agencies described providing technical assistance, training, and hands-on support to help local governments understand methodologies, process raw data, and complete inventories. This assistance is positioned as ongoing support rather than one-time guidance.
Existing Examples of Progress:
Further Progress Pathways
Region(s): Statewide
Solution Spotlight
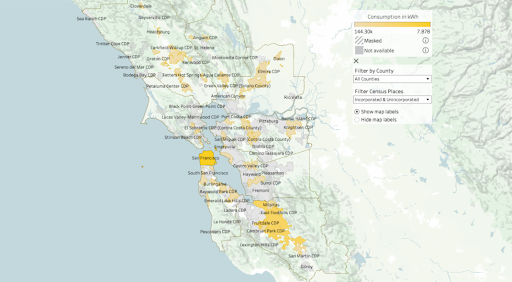
UCLA’s Energy Atlas partners with Regional Energy Networks to Provide Access to Energy Data
The Bay Area Energy Atlas—one of the nation’s most comprehensive energy tools—has been revamped with new features, expanded data, and a more user-friendly interface. Developed by UCLA in partnership with BayREN, the Atlas helps users explore regional energy use through interactive maps and detailed building data. From policymakers to curious residents, anyone can now dive deeper into energy trends by city, building type, or time period. New tools make it easier to compare communities and visualize consumption with monthly data through 2021.
State support for UC Berkeley’s GHG Inventory Tool
The CoolClimate Network at UC Berkeley is developing a data platform for GHG inventories and climate action metrics for local governments across California. The project was presented at CCEC 2024 and 2025 to gather input from participants. The outputs available to cities and counties (unincorporated counties are in the works) include traditional and consumption based inventories from 2010-2022. They also feature tangible metrics such as EV registrations with the DMV and heat pumps installed through TECH incentives. These detailed metrics are more informative and actionable for implementation than overall GHG emissions. They enable local governments to set concrete targets and tell compelling stories about climate action, benefits, and potential impacts in their communities. The emphasis on these metrics reflects the emerging trends of climate action practice, which seeks to be more relatable to people and integrated with equitable community benefits.
The climate action data tool allows local governments to more efficiently conduct GHG inventories and evolve their climate action efforts and communications to focus on community benefits. The practice of local government climate action was originally established in the mid 2000’s in response to a lack of federal leadership. The current context calls us not only to continue but become more effective while delivering quantifiable social benefits and having the metrics to tell compelling stories.
CARB staff and contractors participate in the project’s advisory group and are evaluating whether this tool will meet the needs of local governments.
Help us strengthen our knowledge base!
Help us to expand our database. Either share new ideas, best practices or general feedback via this form, or click on a particular item to share additional feedback, information, examples of progress on that particular item.